|
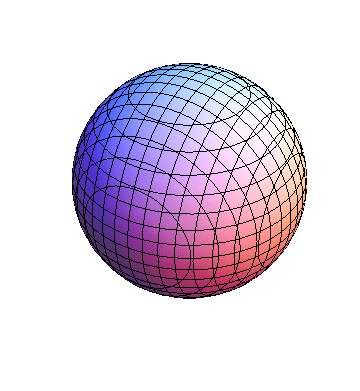
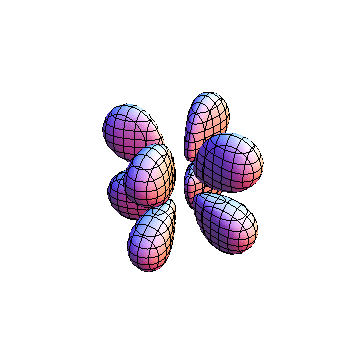
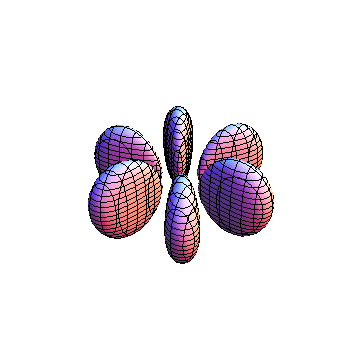
These orbitals were generated using the Mathematica script which can be found here.
|
|
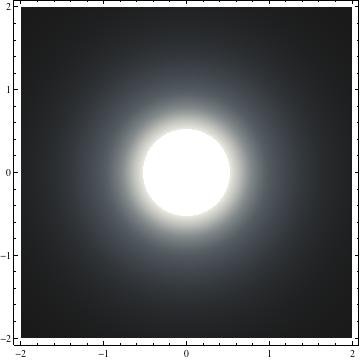
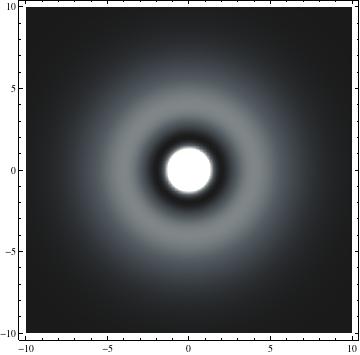
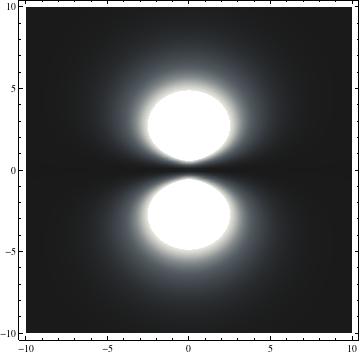
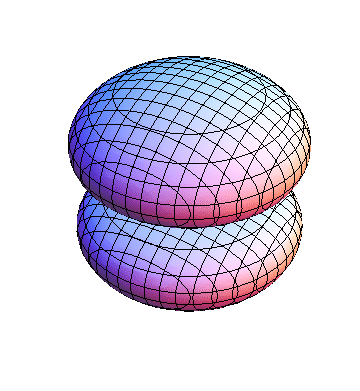
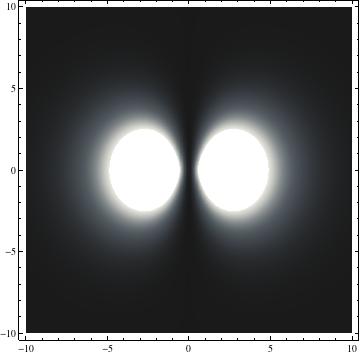
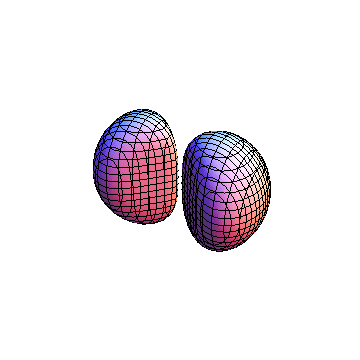
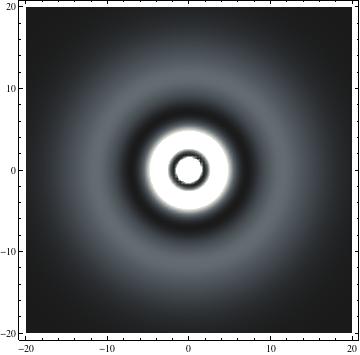
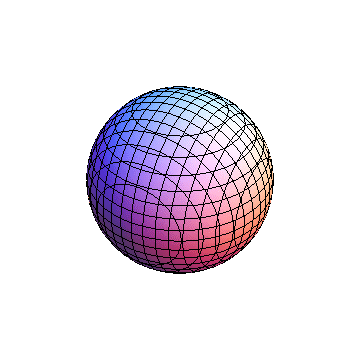
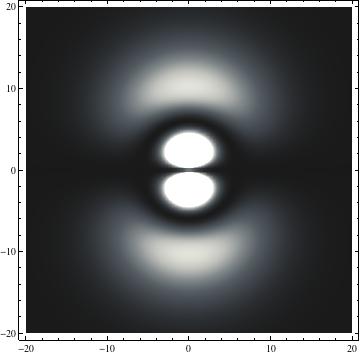
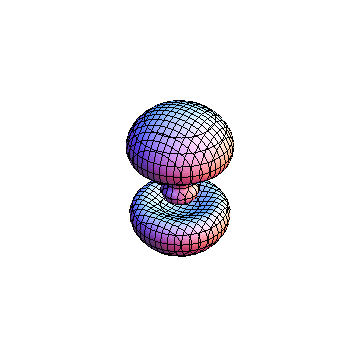
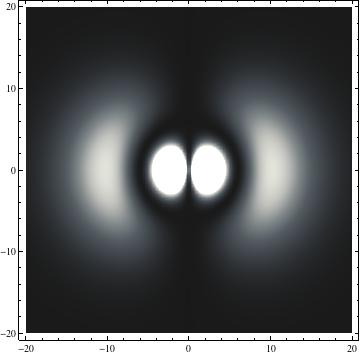
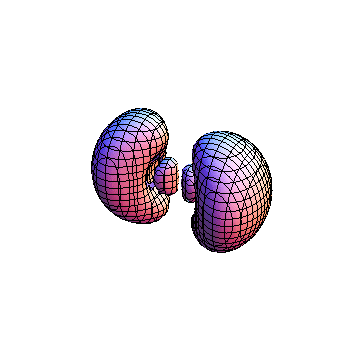
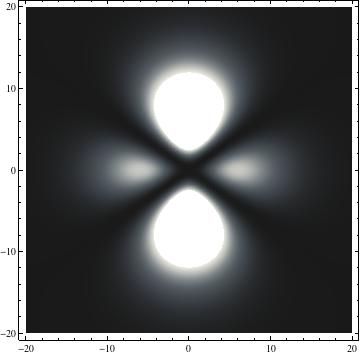
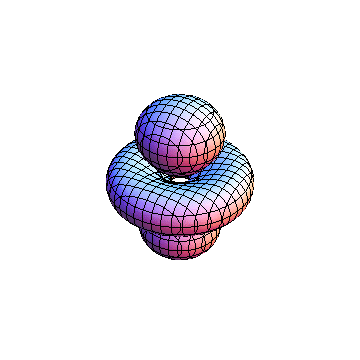
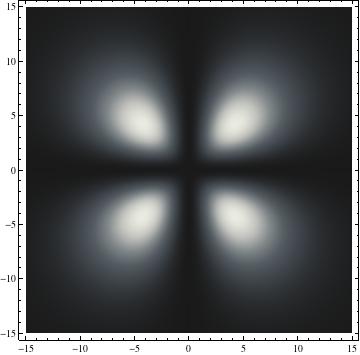
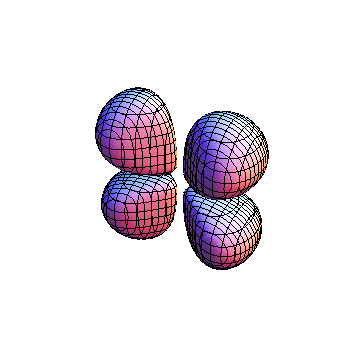
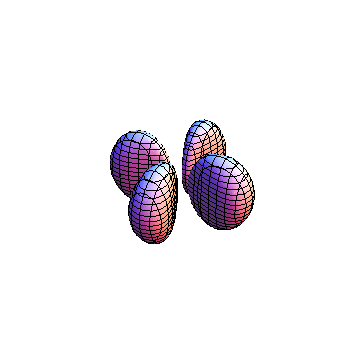
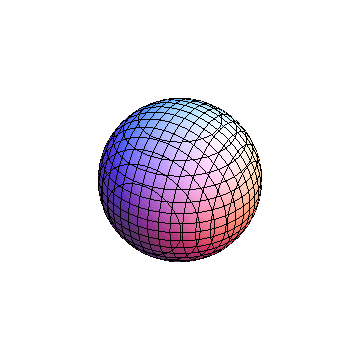
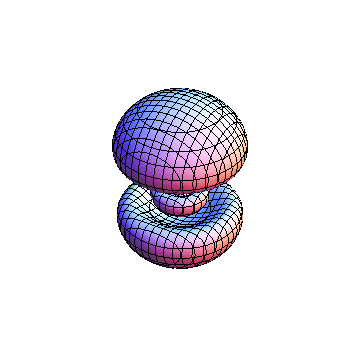
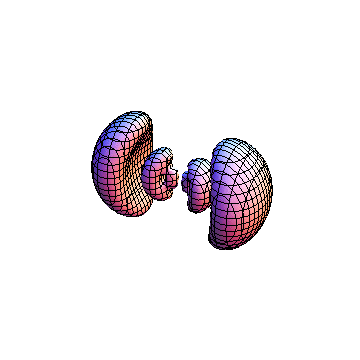
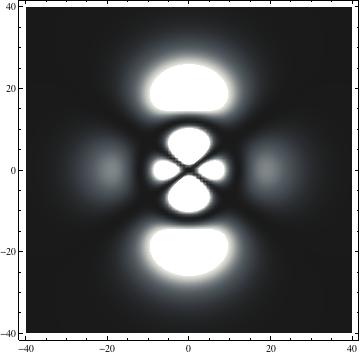
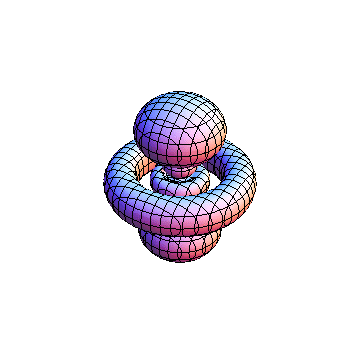
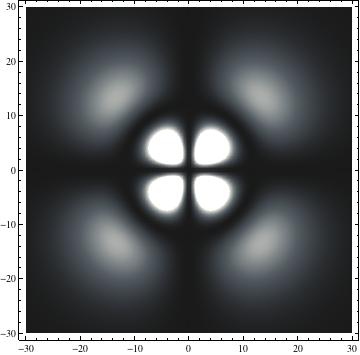
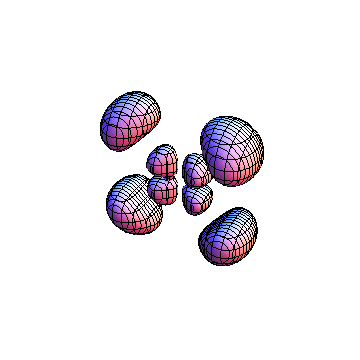
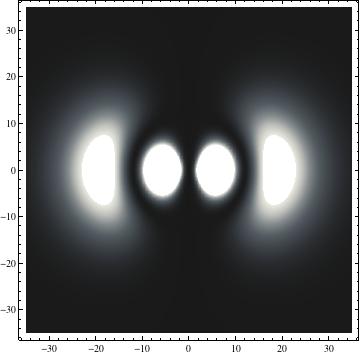
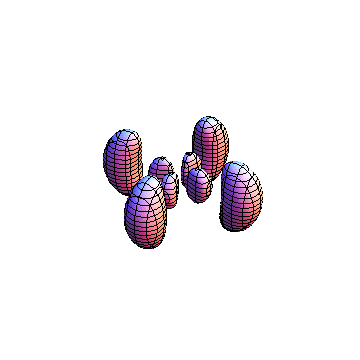
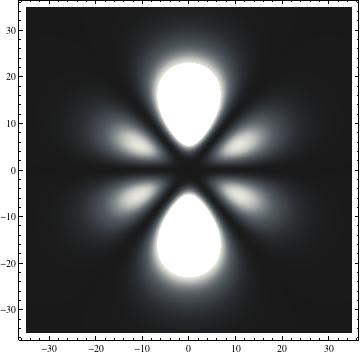
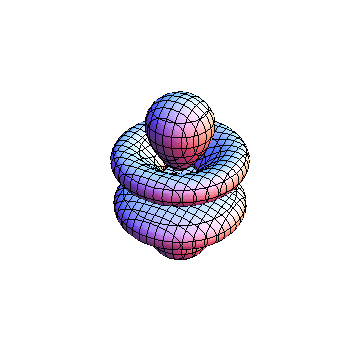
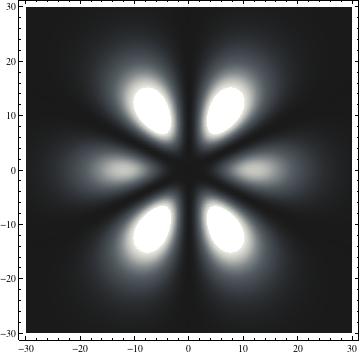
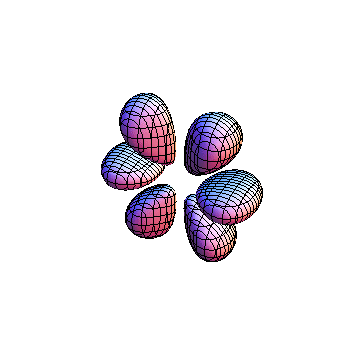
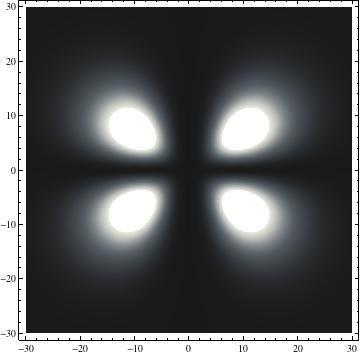
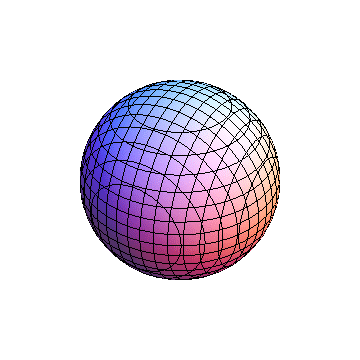
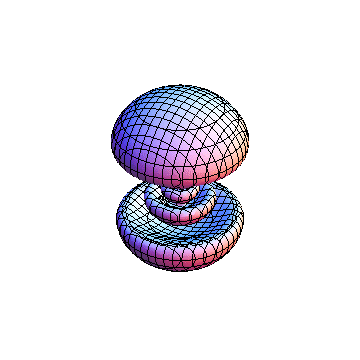
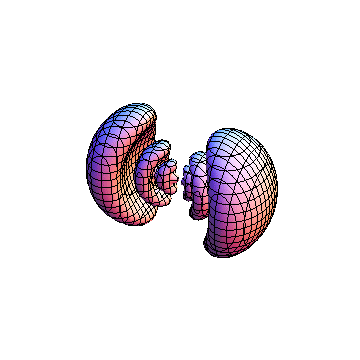
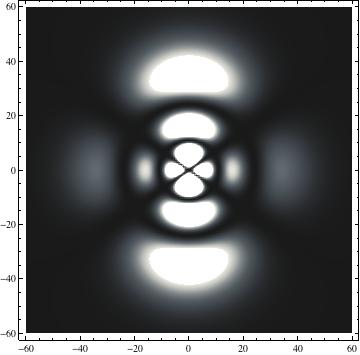
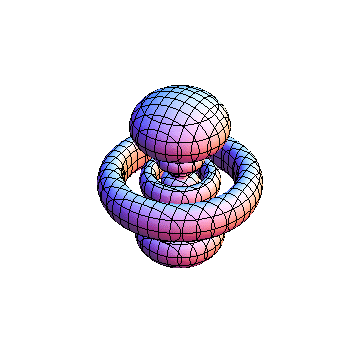
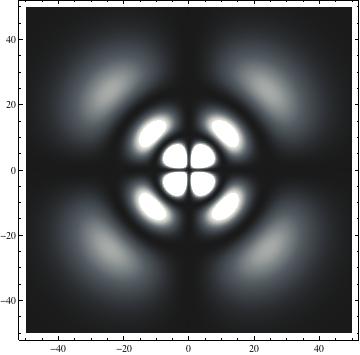
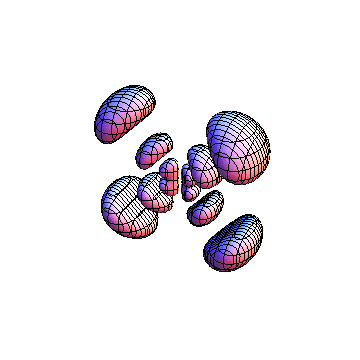
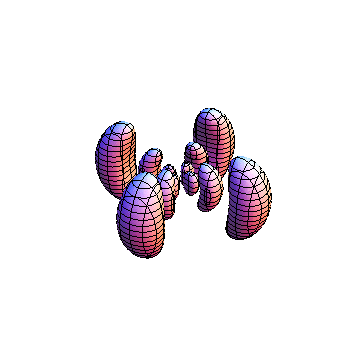
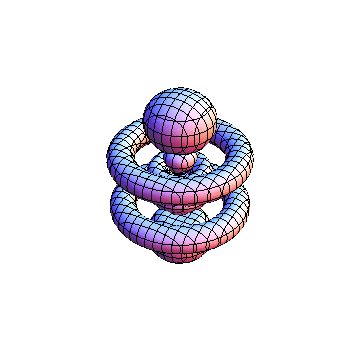
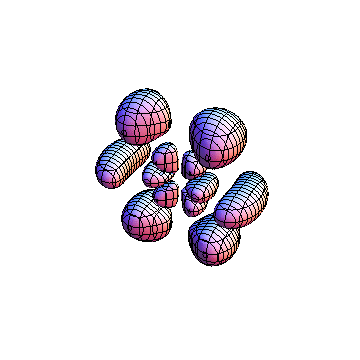
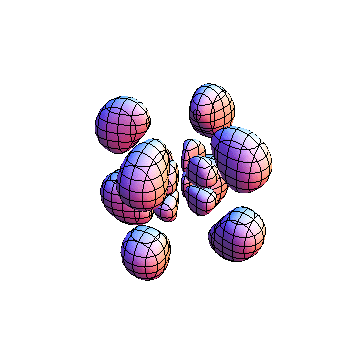
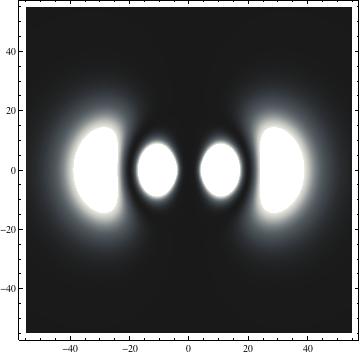
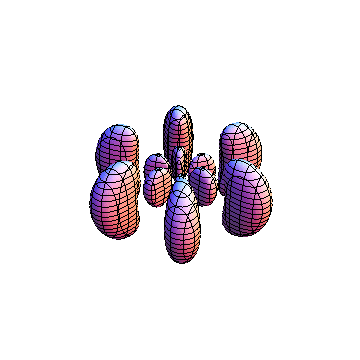
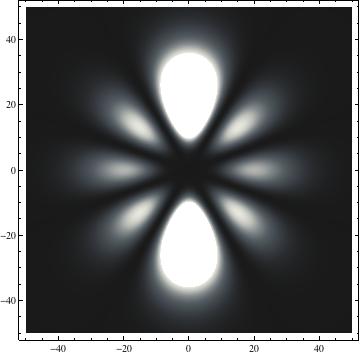
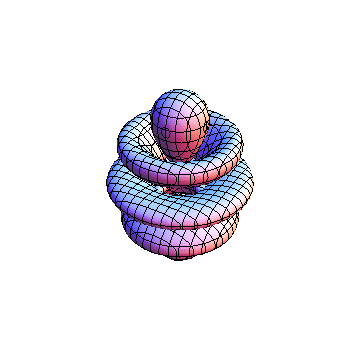
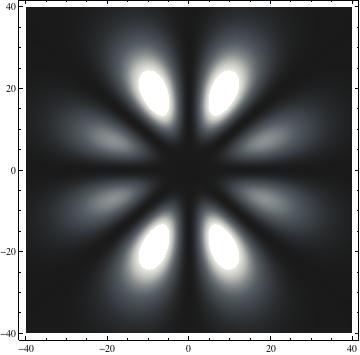
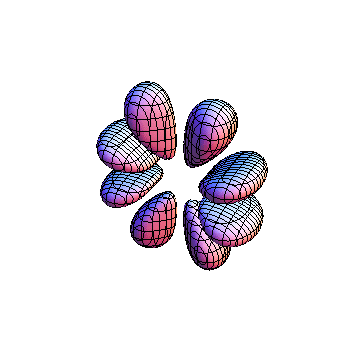
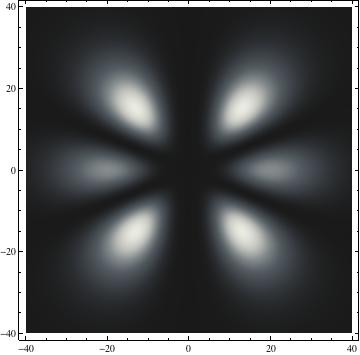
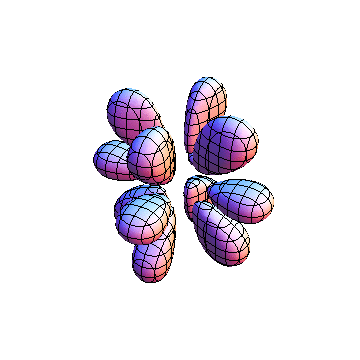
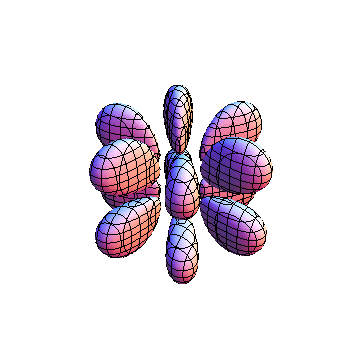
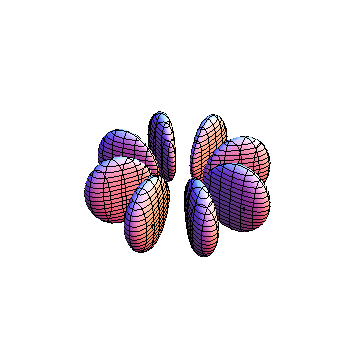
The plots are generated from the exact Leguerre and Legendre polynomials, but aren't quite density plots. In order to plot the traditional "orbitals" as presented by a chemistry course, I had to fudge on the definition of density. In QM, probability density is defined as Psi*Conjugate[Psi]. However, this actually results in a totally symmetric object about the z-axis in all cases, similar to the l=1, m=0 cases displayed here. In order to get orbital-looking things, I had to throw out the imaginary part of the wavefunction. What is displayed here is actually Re[(Psi)^2].
|
|
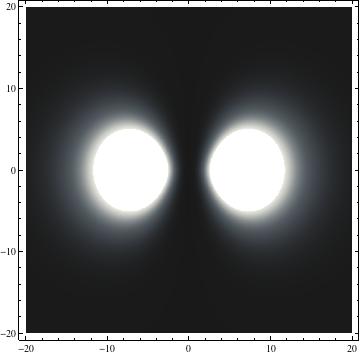
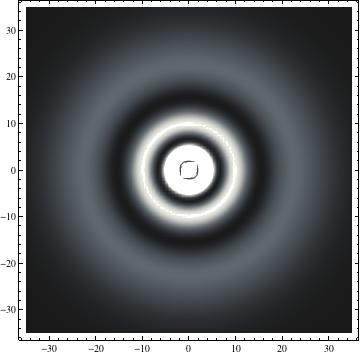
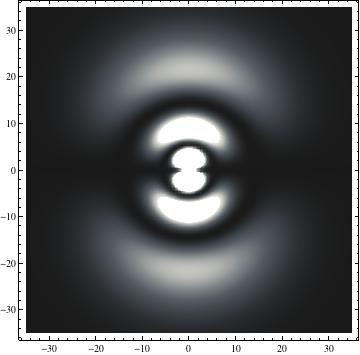
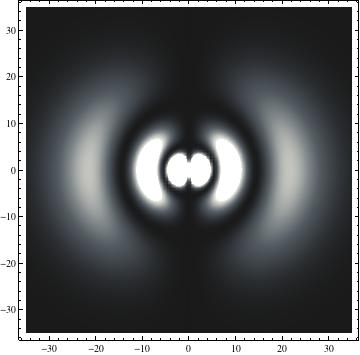
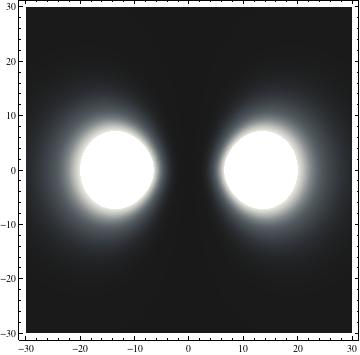
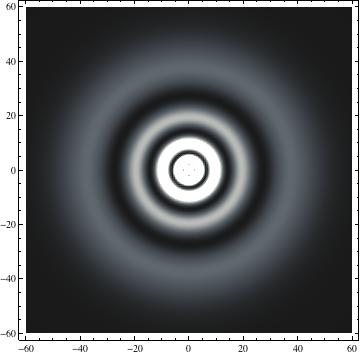
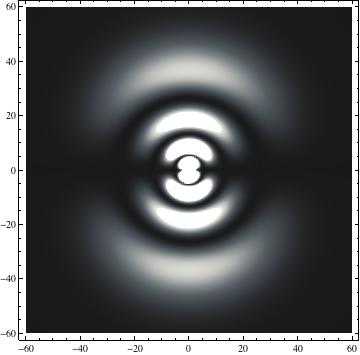
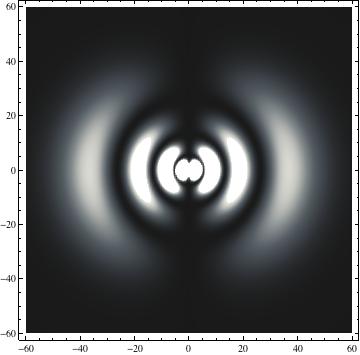
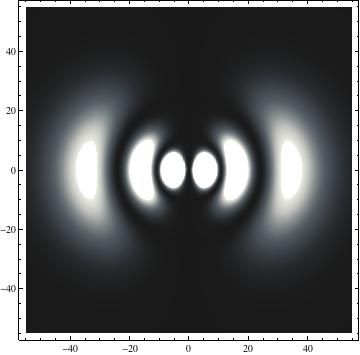
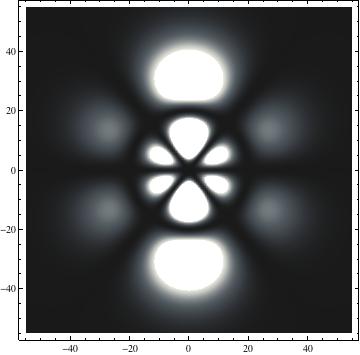
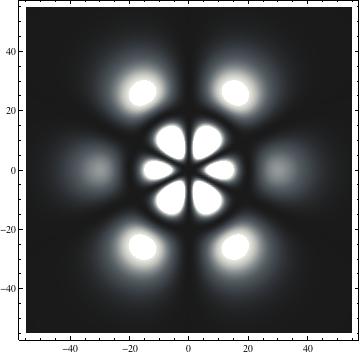
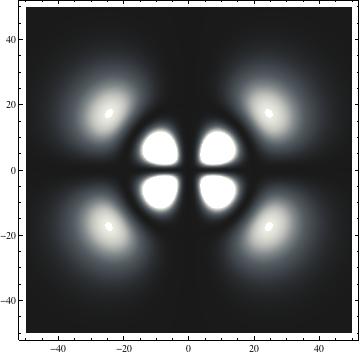
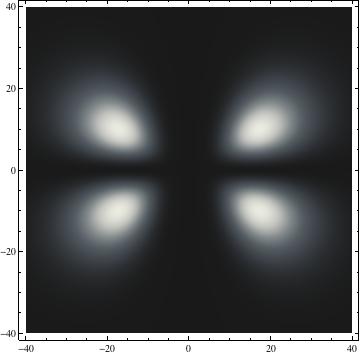
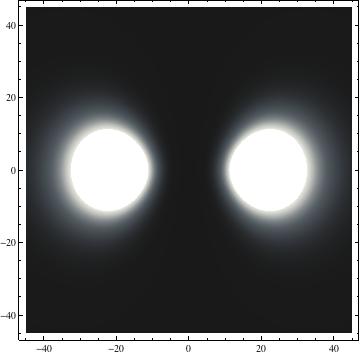
I was not able to show the relative sizes of the 3D objects very well. If you want to see how big the thing you're looking at is, right click the black and white density plots and select "view image". This view should allow you to read the axes, which are in units of "a", the Bohr Radius, which is 0.529 Angstroms (10^-10 meters).
|
|
I didn't bother plotting anything with a negative value for m. These have only very subtle differences from their positive cousin.
|